by Vahe Andonians on Jan 23, 2023 1:15:21 PM
Using the right metrics to evaluate artificial intelligence (AI) models is critical to ensuring they perform effectively and achieve their goals. In this blog, we will examine four of the most popular metrics, see how their results compare, and show how to apply them in different situations.
While it may be tempting to rely on the opinions of data scientists rather than metrics, this approach may not provide a relevant picture of a model's performance and may even lead to incorrect conclusions about its effectiveness. Evaluating AI models is a control function, and a well-designed system should not entrust creation and control to the same group. More important, the business side knows more about the structure and decomposability of the work, which puts them in the best position to integrate automation through AI in a meaningful way. Provided, of course, that they understand how to evaluate AI models with the right metrics.
Evaluation of AI models must be a continuous effort. The modern business-centric approach typically releases models into production, making the business incrementally better by generating relevant training data through daily operation. However, even if AI models are unchanged, for compliance and other reasons, continuous performance evaluation is crucial to discover eventual drifts. Even slight changes in input data can have detrimental effects on model performance.
There are numerous metrics that can quantify performance. Most can be categorized by prediction type. Regression, for example, is a type of prediction in which the output variable is numerical and continuous, such as predicting a person's blood pressure. The mean squared error (MSE) is a popular regression metric.
Classification is a type of prediction in which the output is a category. A classification model might predict if an email is spam or not, for example. Four of the most popular classification metrics are precision, recall, accuracy, and F1 score. These four are the most important metrics to understand when evaluating the effectiveness of an AI model. Together, these metrics can help a business understand whether an AI model is truly achieving its goals, and if not, how best to correct it.
These four can sometimes cause confusion, but understanding them is crucial because they provide the best guidance to business decision makers on how a collaborative human-machine workflow should be destined within their organization.
Start with the confusion matrix
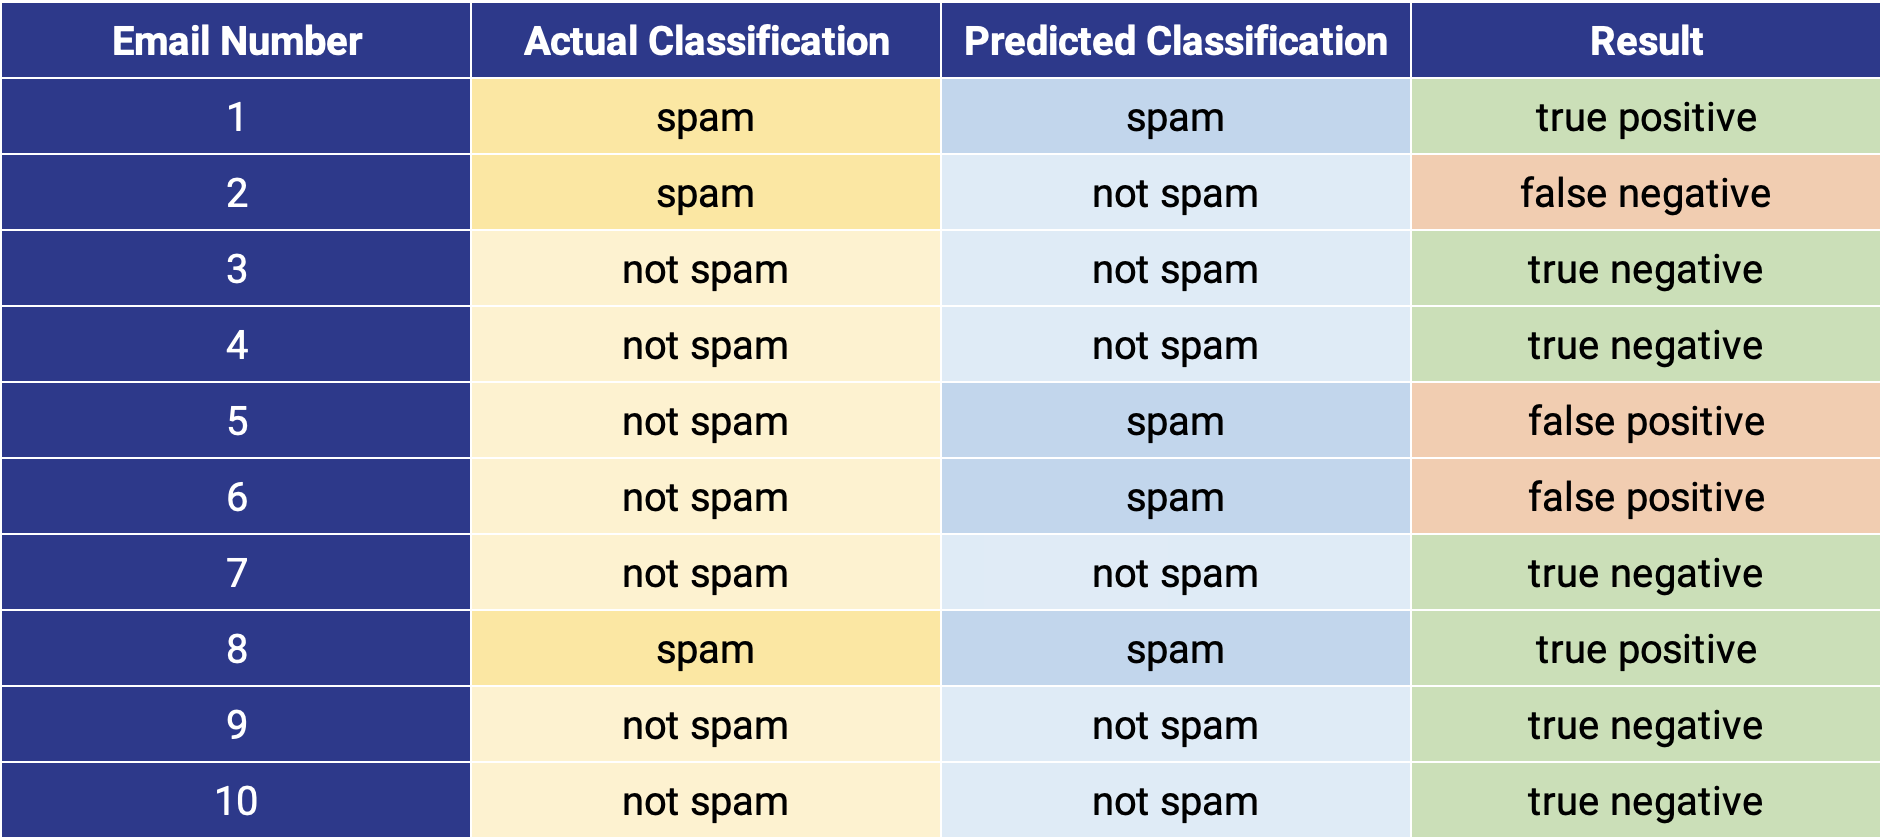
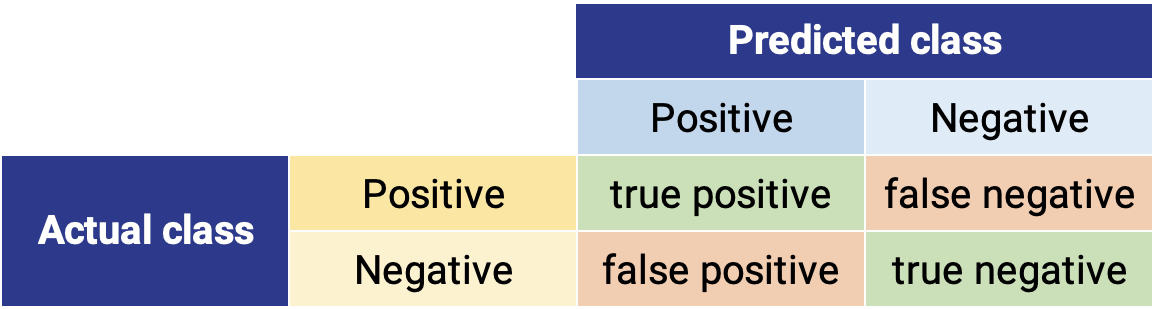
The confusion matrix is a detailed way to visualize the performance of a classification task. The rows represent each data point's true class, while the columns represent its predicted class. The cell values show how many data points were predicted to belong to a particular category. For example, suppose the model is trying to predict whether or not an email is spam, as illustrated below.
In this confusion matrix, the rows represent the true class (spam or not spam) while the columns represent the predicted class. The outcomes can be correct in two ways (true positive and true negative) and incorrect in two ways (false positive and false negative).
The confusion matrix can then be used to understand how well the model classifies emails.

In our example, the AI model correctly classified real spam emails twice (true positive) and non-spam emails five times (true negative). Together, these results represent the desired outcomes of the model.
Precision
The precision metric represents the fraction of correctly positive predicted cases among all positive predicted cases.
![]()
In our example, the AI model classified four emails as spam (predicted class positive). Two were actually spam (emails 1 and 8) but two were not (emails 5 and 6), which are reflected as “false positive.” We can compute precision as follows:
![]()
The precision of an AI model has an important impact on how its predictions are used. In this example, a model with 50% precision would incorrectly place every other email in your spam folder. In other words, you would have to spend a great deal of extra time reviewing the email in your spam folder, defeating its purpose.
Recall
The recall metric represents the fraction of correct positive predictions among all actual positives.
![]()
Our sample dataset has three actual spam emails (emails 1, 2, 8), reflected in the sum of the top row (sum of "actual class positive”). Two were correctly classified (emails 1 and 8), but one was not (email 2), which is reflected in the "false negative." We can compute recall as follows:
![]()
Like precision, recall has an important impact on how predictions are integrated into actual workflow. In this case, the 67% recall means that 33% of all spam messages still find their way into your inbox.
Both the precision and recall metrics are telling us that our AI model is not performing effectively. But context is critical for understanding which of these metrics is more important.
In this case, the context is the relative importance of a legitimate email compared to spam. For example, the 50% of legitimate email messages incorrectly moved to the spam folder (precision) are a much bigger problem than the 33% of undetected spam (recall). In the first case, you are not seeing a potentially important email. That is much different than seeing more spam than you might expect.
A different context, of course, can invert these values. Suppose the AI model is not classifying email messages but rather dangerous and harmless material in the carry-on baggage of air travelers. In that instance, the opposite is true. It is much more important for an airport security agent to sort through a few more pieces of baggage (lower precision) rather than miss a potential security threat (high recall).
Depending on the use case, recall or precision may be much more important. While it may be obvious which one to prioritize in these examples, it is much less clear for many financial use cases. As a result, it is important for line of business managers to understand these metrics, so they can better evaluate AI models and work with data scientists to improve their performance.
Accuracy
The accuracy metric represents the fraction of correct predictions out of all predictions.
![]()
The confusion matrix includes the correctly predicted negative classes (“true negative”), or all the non-spam emails that were classified correctly (emails 3, 4, 7, 9, and 10).
In our example, seven emails out of 10 were classified correctly, which we can compute as follows:
![]()
While accuracy is intuitive, interpreting it correctly relies heavily on evenly presented classes in the data. Luckily, most people receive far more legitimate emails than spam, which is reflected in our sample dataset (three spam emails (emails 1, 2, and 8) and seven non-spam emails (emails 3, 4, 5, 6, 7, 9, and 10). Now suppose instead of meticulously developing an accurate AI model, you just created a model that insidiously marked all emails as non-spam.
How accurate would your prediction be?
The confusion matrix would look like this:
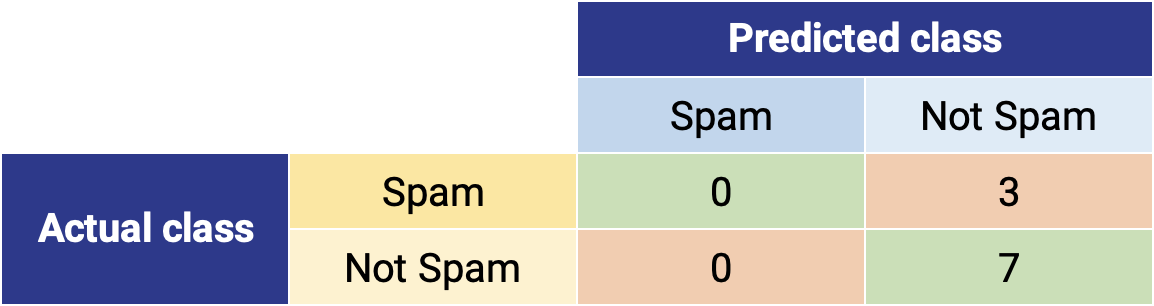
Precision and recall would both be zero because the "true positive" cell is zero. This is exactly what you would expect from such a deceitful model. However, while we might expect an accuracy rate of 50% (similar to a coin toss) the actual accuracy is 70% because of the natural imbalance in the data. In other words, the accuracy is higher than expected due to uneven presentation of data classification:
![]()
High accuracy is not necessarily indicative of effective performance. Our purposefully bad model, which sends all your email to the same inbox, delivers 70% accuracy without even trying.
F1 score
The F1 score is the harmonic mean of precision and recall. It is a good metric to use when you want to balance precision and recall—especially in cases where accuracy may be distorted by classification imbalances in the data. The formula for the F1 score is:
![]()
In our example, the precision is 50% and recall is 67%, resulting in an F1 score of 0.57:
![]()
Unlike accuracy, the F1 score is not susceptible to uneven class distributions that are very common in large-scale multi-class tasks. In multi-class tasks, an AI model does not differentiate between two states but rather a wide variety of classes.
Suppose you are evaluating an AI model that predicts what animal species is shown in a digital photo. It makes sense to assume there will be more photos of cats, one of the most popular domestic animals in the world, than vaquitas, which are nearly extinct. In the same way, you can assume a large tail of species with very low representation in the dataset. This underrepresentation will artificially increase the number of true negatives and therefore distort the accuracy. (If you want to know what animal is in the photo, the answer “it is not a vaquita” is simultaneously true and not especially helpful.) Underrepresentation will also make it difficult for the AI model to learn what a vaquita is and predict it accurately because it appears so infrequently in the data.
The F1 score is ideal for such situations. While not as intuitive as accuracy, it is a better metric for imbalanced data.
The F1 score is a useful metric for balancing precision and recall. While not as intuitive as accuracy, it is a better metric for imbalanced data.
Conclusion
If you understand the tradeoffs, these four classification metrics can help you evaluate the performance and effectiveness of AI models. Even more important, line of business managers will be better equipped to collaborate with data scientists on how to refine the model for better results and easier integration within real-world workflows.